How to use visual attributes to create contrast and attract interest

Visual elements are the things you put on your page or screen. For a software application, this can include user interface widgets like text fields, buttons, drop-down boxes, menus, and so on. But it also includes text, images, icons, and organizational or decorative elements like borders, lines, and separators.

Visual attributes are properties of visual elements – the different ways that you can “style” the visual elements on the page.

In designing the visual style for your application or website, you’ll need to decide on a system of arrangement of visual elements, combined with a consistent way to style those elements using visual attributes. Elements with similar function and meaning should usually be styled the same way.

But you can also selectively use attributes to create contrast. Contrast is an intentional difference between two elements. Contrast can be eye-catching, and we can intentionally use contrast to highlight or draw attention to a particular element, or to provide clues that two elements are different in some conceptual way.

Here are some of the main visual attributes you need to be aware of:

Size

The most instantly noticeable visual attribute of all is size. We can’t help but notice when one element is bigger than another, and, all other things being equal, our eyes will almost always look at the biggest thing on a page first. So size can be used to draw attention to something.

For example, book designers have for centuries used “dropcaps” – like in the “E” in the paragraph below – to help direct the eye to the beginning of long blocks of text (which are not always visually exciting):

Example of a dropcap at the beginning of a block of "lorem ipsum" textIf an element is bigger than other surrounding elements, the contrast in relative size makes the bigger element visually dominant. We perceive a big, dominant element to be more important than the other elements.

For example, here, despite not being able to see the contents of the panels, we would generally assume that the big center panel is the most important on the basis of its size:

Image of a screen layout with a dominant panel in the centerThe relative size of elements can be used to communicate the intended relative importance of those elements – for example, you might expect that certain features will be used more frequently, so you might make the buttons for those features larger than the buttons for lesser-used features.

Users may also have their own expectations for what is important and not, and they could be annoyed if seemingly irrelevant things are taking up too much screen real estate.

For example, a time-and-date clock in the corner of an accounting program should be small because, while convenient, it has little to do with the main task of the application. However, in a “chyron” system for overlaying graphics onto live television broadcasts, a time clock with millisecond precision is pretty important for synchronization, and so making it quite large and prominent would be justifiable and expected.

Size contrasts can also be used as a highlighting technique. For example, in this particular view of the Mac OS dock, the currently selected item is biggest:

MacOS dock using size to indicate selected item

Color

After size, color is generally regarded as the next most immediately noticeable attribute. Colors, if applied carefully, can be used to attract attention and guide the eye. Color can also work very well for suggesting importance: brighter, more intense colors tend to suggest more importance and urgency than duller, muted colors.

Color contrast example (yellow box stands out against blue boxes)Color can also be used to suggest similarities and differences. Elements sharing identical colors are perceived as belonging to the same group, whereas elements with contrasting colors are perceived as belonging to different groups.

Colors can also have implied, culture-dependent meanings, like red indicating “danger” or “stop”, or green meaning “OK” or “go”.

(Color is an important and complicated topic that we’ll explore in more detail in future blog posts.)

Shape

We can perceive and differentiate the outlines of shapes very easily: we can quite rapidly tell the difference between squares, circles, and triangles.

You can draw attention to one object if it has a different outline shape than the objects surrounding it – for example, a round or a pointy angular shape in a sea of boxes.

Sequence of squares with one starburst shape as contrastAs shown in a previous post, the icons in the following Mac Finder window all have the same general outline shape, so it takes a bit of effort to tell the difference between them:

Mac OS "Finder" window showing files of different types with corresponding icons

Direction, angularity

Elements like text, lines, or graphics that are set at an angle can be quite eye-catching. The angles create “tension” by breaking the traditional rules of grid alignment.

Example of a headline set at a diagonal angleTraditional design wisdom says that angular elements are perceived as being unconventional and “edgy”, so conservative, respectable business applications like banking websites might want to avoid them, while they might add dynamism to entertainment or game applications.

Weight

Weight refers to the thickness of lines:

Comparison of increasing line widthsWhen applied to text, weight refers to the thickness of the lines of the letterforms. Bold text has a heavier weight – more “heft” – than regular text.

Many typefaces are available in families, where the letterforms have the same basic shapes but have different weights. Most famous is Helvetica:

Helvetica Neue typeface in different weights The contrast and similarity of two words, set side-by-side, using the same font but with different weights, can create a really awesome look – though some would argue it’s an over-used design cliché:

Using contrasting weights of the Helvetica typeface to create a contrast and similarity effectText styling/decoration

Apart from size and weight, further attributes for styling text are decorations like italics and underlining.

Additionally, contrast can be created by intentionally pairing typefaces from different categories – for example, pairing a sans-serif font for headings with a serif font for the body text. We’ll talk more about this when we cover typography in a future blog post.

Texture

Texture can refer to giving visual elements the appearance of surfaces that, if they were actually touchable, might feel rough, or smooth, or concave or convex, etc. Panels and buttons might look like they’re made of shiny brushed metal, or illuminated plastic, or semi-transparent glass; websites might use decorative backgrounds that look like paper or wood. The so-called “Web 2.0” look relies a lot on illumination, reflections, gradients, and shading effects to create a more sophisticated, “photorealistic” texture that stands out more than simple blocks of plain colors.

In the following illustration, on the left, buttons from Mac OS and Windows 7 are shown; these look like raised, convex, clear plastic buttons that look very pressable. In the center, a scrollbar from Java Swing’s (old) Metal look-and-feel has a nice grippy tactile texture that makes you want to touch it and drag it up and down. On the right is an example of a novelty background texture for websites (courtesy of www.allfreebackgrounds.com).

Examples of uses of texture in UI and web designGiving some thought to creating texture can give your user interface some eye-catching “pop” and a unique look-and-feel, but for business applications, you probably don’t want to get too carried away with overly distracting decorations; it’s best to stick to more conservative styling. Novelty textures, like UI components appearing to be carved out of wood or stone, might help give an immersive ambiance to a game, however.

Note that graphic designers also use the word texture to refer to the overall visual effect of a block of text. If you look at a block of text and squint or defocus your eyes until you can no longer distinguish the actual words, you can sort of see a “texture” emerge. Or, if you were to imagine that the text were raised off the page, and you could close your eyes and rub your fingertip over it, then a block of text set in Times New Roman (upper left) would probably feel different to the touch than a block set in Helvetica (upper right), or Times New Roman Italic (lower left), or Gill Sans Regular (lower right).

Comparison of visual textures produced by blocks of text set in different typefacesSurrounding space

Humans place value on space, and so things that take up more space than necessary tend to be perceived as important and valuable.

If an element is in a region that’s tightly-packed with other elements, it will not stand out. But if that element is surrounded by generous whitespace, we’ll tend to believe it must be either special or valuable to deserve all that space.

Summary

We’ve examined the most important visual attributes and we’ve seen some basic examples of how the careful, intentional use of visual attributes can create contrast and attract interest. Upcoming blog posts will continue our exploration of graphic design for user interfaces, so stay tuned!

[ad#AdSense_MedRect]

Posted in User Experience Design, Visual Design | Leave a comment

Unity: A primary goal in visual design

When you’re designing the visual layout of a website or a software application’s user interface, you want it to look good. But what makes a good design good?

Graphic designers often say that aesthetically-pleasing creative works possess unity. By this, they mean that everything simply just fits together and “flows” well.

Your page composition exhibits unity when…

  • all the elements on the page appear to belong there;
  • there are no extraneous elements that don’t belong there; and
  • all the elements are arranged in such a way that they appear to belong together.

Unity is obviously a goal you should aim for. But it’s hard to explain exactly what makes a design exhibit unity, and even harder to create a step-by-step checklist of how to achieve it – after all, visual design is an art, not a science!

At the very least, when you’re designing your page layouts, you should try to keep the following principles and ideas in mind:

  • Consistency: Visual elements like fonts, colors, rules, icons, and decorations should be used consistently across the page.
  • Coherence: The design should make sense conceptually. Elements with similar functions and similar importance should be styled with similar attributes (size, color, font, weight); elements that are of the same general type but which differ in importance should share certain attributes but vary others.

For example, if your design has three levels of headings, they should typically all share the same typeface, but the more-important levels of headings should use a larger type size or thicker weight than the headings at lower levels of importance. In a future post, we’ll further explore this idea of creating a logical visual hierarchy to graphically express relationships and concepts like relative importance.

  • Continuity: The same visual style and layout scheme should be repeated across all pages on the website, or across all screens and dialogs in a desktop application. Ideally, this consistency should be maintained across all of your organization’s products. Adobe does a great job of maintaining a unique and consistent look-and-feel across all the programs in its Creative Suite product line; in constrast, in Microsoft Office 2007, programs like Word, Excel, and PowerPoint used the “ribbon” menu but Visio did not.
  • Simplicity, restraint, and minimalism: While you do want to make your pages look interesting and eye-catching, you should aim to create a simple design rather than one cluttered with excessive fancy decorations and distractions.
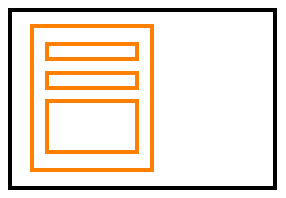
  • Balance and dominance: You want to use the space on the page effectively and attractively. If your page is tightly-packed with content on the left side, but the right side is empty, your page will look lopsided. If you tried to somehow balance the page on a scale, it would tip over to the left:

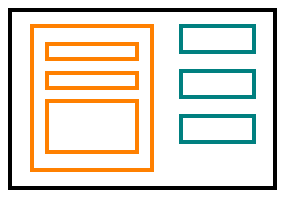
Example of an unbalanced pageThis doesn’t necessarily mean that all pages have to be symmetrical, however. Asymmetrical designs tend to look more interesting — graphic designers call it “dynamic tension”. Even though an asymmetrical design might have a dominant feature, like a large, eye-catching panel on the left-hand side, the design could still achieve balance by positioning, say, three smaller boxes on the right-hand side:

A page with better balance

  • “Good Gestalt”: You should be able to perceive the design as a coherent whole, rather than a chaotic mish-mash or mosaic of elements.

A design that expresses unity gives the viewer the impression that there is some kind of underlying concept or scheme giving order to it. You want the viewer to feel that there was an intelligent designer behind the work, and that the designer deliberately and intentionally chose and developed that particular design. The alternative is for the viewer to suspect that the design was slapped together haphazardly or by accident – and you don’t want that!

So for websites and applications that have many pages or screens, consistency and unity in the visual design is key for creating a pleasant User Experience.

Think of it this way: It takes mental effort for a user to look at and make sense of a page. Users look for patterns, and once they start to see patterns, they begin to form expectations. It becomes distracting and even disturbing when these expectations are then violated by inconsistent or sloppy design.

If your design is consistent and exhibits unity, users will begin to trust the design (and by extension, the designer). This trust sets users’ minds at ease. They can relax, knowing that they’ve figured out the patterns and concepts that underlie the design, and they no longer need to spend mental effort on that task.

In upcoming posts, we will continue exploring the use of visual elements, visual attributes, and visual design principles in order to learn how to create attractive and understandable user interfaces.

[ad#AdSense_MedRect]
Posted in User Experience Design, Visual Design | Leave a comment

Software delivery mechanisms: Comparing desktop applications, web apps, and static websites

Let’s compare some of the different “delivery mechanisms” for software products, and what impact the different options can have on the User Experience. In this post, we’ll look at the following classifications:

  • Desktop applications vs. web applications
  • Static websites vs. web applications
  • Shrinkwrap products vs. enterprise applications vs. Software-as-a-Service

Desktop applications vs. web applications

Desktop applications are software programs that, in general…

  • are targeted to a particular platform or operating system;
  • usually use the native user interface controls and look-and-feel of the target operating system;
  • are either downloaded, or distributed on CD-ROMs or other media;
  • run on the user’s local machine;
  • usually need to be installed before they can be run; and
  • usually do not require the user to have a user account and to login.

Web applications…

  • should be usable with any web browser running on any operating system or platform;
  • can use user interface controls and have a look-and-feel that is different from those of the native operating system;
  • are hosted from a server, so generally no software needs to be downloaded, installed, and run locally;
  • the user interface is presented in the user’s web browser;
  • the data storage, processing, and business logic are usually handled completely by the server;
  • typically require a user to have a user account and to login.

How do desktop and web applications differ from a User Experience standpoint?

  • Early web applications supported few interactions beyond simple form-filling, as user interface controls for richer, direct manipulation interactions like dragging-and-dropping or drawing objects on a canvas weren’t available. “Content creation” applications like paint programs and spreadsheets were thus better-suited for desktop apps. However, modern web technologies and frameworks have pretty much eliminated the gap between web and desktop applications. Google Docs, for example, is a web-based office suite whose word processor, spreadsheet, and presentation tools work in all the ways that users are accustomed to with desktop office suites.
  • Web applications sometimes feel slower and less responsive than desktop apps, due to the need to send requests to the server over the network and waiting for a response. However, desktop apps have the same latency issues if they communicate with a remote server, and web apps can often be made more responsive through clever architecture and the use of client-side technologies like Javascript, Flash, or Java applets. Pixlr is an impressive web-based photo editing tool with very little noticeable latency.
  • Desktop apps save data to the user’s local storage, whereas web apps save data “in the cloud”, on the remote server.
  • Security is more of a concern for web apps, as users can lose control of their data and on-line identities if they forget their passwords or if their accounts are hacked.
  • Some users prefer the security of “owning” a copy of the software program on their local machine, which remains accessible even when Internet or network connectivity is unavailable, or in case the vendor ceases to exist. Others prefer the convenience of not needing to install the program, back up data, and install updates and patches.

Static websites vs. web applications

A “static” or “content” website…

  • primarily features content (e.g., text or videos) that remains fairly static;
  • offers navigation as the main (but not necessarily only) means of interacting with the site;
  • may offer some interactive features, but the majority of the user’s time is typically spent viewing content;
  • is usually accessible to the general public, although access to some features may require a user account and logging in.

Web applications are highly interactive, and are typically based around a central database or other form of storage, are based on some proprietary algorithm, or both. They allow users to create content or communicate with other users, or they serve some specific business function, like managing an organization’s bookkeeping and accounting, or allowing customers to book airline reservations.

The dividing line between “websites” and “web apps” is not always clear. People don’t usually think of content-oriented websites like Wikipedia as “software”, even though Wikipedia is interactive and is obviously powered by software. Consumer-focused e-commerce sites, like Amazon.com or an airline reservation website, have more obvious software functionality but are still usually considered “websites” rather than “software”. Google Docs, however, would be considered by most people to be “software” and is clearly a “web app”.

Shrinkwrap products vs. enterprise applications vs. Software-as-a-Service

Enterprise applications are typically large, multi-user applications that manage specific critical business processes for an organization. They are usually “bespoke” applications: they are custom-developed, either in-house or by a contracting organization. Some vendors offer standardized software products that they then heavily customize for each client organization. The customized product is then an enterprise application for that organization.

Enterprise applications involve a central server managed by the organization. The end users access the application either via a web-based user interface, or via a desktop client program that connects to the server.

“Shrinkwrap” or “mass-market”” software products, such as Microsoft Office, are usually desktop applications intended for individual users. In organizations, each user needs a separate copy. There is typically no vendor customization.

Software-as-a-Service (SaaS) is a bit of a hybrid of these models. SaaS vendors offer a standardized product, on a subscription or usage-based billing model to organizations or individual consumers. The product is usually a web-based application, and the SaaS vendor hosts the server. There is typically little customization (changing of the program code) permitted, but the product may offer many configuration options.

 [ad#AdSense_MedRect]
Posted in Product Management, User Experience Design | Leave a comment

What should you look for in a usability trainer?

On the User Experience Stack Exchange, Sushil Bharwani recently posted a great question asking for advice on how to choose a trainer to provide instruction on usability techniques. I responded with the following suggestions:

If I were hiring a usability trainer, I’d want evidence that the trainer…

  1. knows the appropriate material well;
  2. has real experience in the field; and
  3. is a good teacher: he or she can explain complex ideas clearly, has a good stage presence, and can engage and captivate the audience and provide a memorable experience.

A certification or a relevant academic degree can serve as a certain kind of proof of knowledge, but in reality, these credentials rarely guarantee actual competence.

I’d personally prefer to see “portfolio evidence”: Do they have a resume showing real-world experience doing usability-related work?  Can they show software that they’ve designed?  Have they actually used usability techniques like card sorts and have they gained better insights into what works and what doesn’t?  Can they show and discuss something like a usability analysis report and recommendations that they’ve written?

If they’ve written a book or if they have a decent blog, that’s another form of proof, and it gives you insight into their communication style.

To judge teaching ability and classroom presence, ask whether they can provide snippets of video recordings from past training sessions.  If not, maybe they could give a short sample lesson as a preview.

Ask for the proposed course outline. Is the content appropriate and is it customized for your organization’s specific needs?  Does it integrate any live activities or exercises to get the participants actually thinking and doing?

Ask for references, and also ask for the results of previous course evaluations, but be aware that a lot of course participants give the trainer high ratings just to be “nice”. A lot of courses are enjoyable to sit through but the students don’t really take away any practical skills. Ask what specific learning objectives the training will address and ask what the participants should be able to do afterwards.

Training is an interpersonal activity, a soft skill, and you have to be comfortable with and generally like the trainer. So in the end, even after considering all of the above, you might well just have to trust your gut feeling about who you like best.

[ad#AdSense_Banner]

Posted in Training, Usability | Leave a comment

The Gestalt Laws of Perception and how to use them in UI design

The Gestalt Laws of Perception help explain how humans perceive and make sense of visual information. As user interface designers, the laws are interesting to us because they can help us better communicate concepts and relationships that exist in our underlying conceptual model for the application.

Gestalt (pronounced ge-SHTALT) is a German word that means roughly means “shape”, “form”, “essence”, or “whole”. Gestalt psychology is based on the idea that, when the human mind perceives the world, it seeks to recognize some kind of structure or order. Specifically, the Gestalt effect suggests that, when we are presented with a complex visual image, our minds recognize coherent, whole forms, rather than individually perceiving all of the smaller constituent parts that make up the image.

That might sound pretty heavy and abstract, so let’s take a closer look to understand what all of that really means.

Wertheimer’s laws

Max Wertheimer’s 1923 paper Laws of Organization in Perceptual Forms (PDF of original article in German) stated a number of principles or “laws” that describe how the mind tends to perceive visual information.

Law of Prägnanz

The basic law, from which the others are derived, is the Law of Prägnanz. Prägnanz might be roughly and imperfectly translated as conciseness or simplicity.

The Law of Prägnanz is a bit like Occam’s Razor. Occam’s Razor states that the simplest explanations for a state of affairs tend to be more likely to be correct than complicated and convoluted explanations that rely on odd assumptions or special conditions. (For example, “an alien stole my homework” is probably an unlikely excuse for why an assignment wasn’t handed in; “I just didn’t do my homework” is a simpler and likelier explanation as it doesn’t presume the existence of extraterrestrials.)

The Law of Prägnanz says that when the mind tries to interpret a visual scene, it will try to interpret it in the simplest, most concise, and most easily recognizable way. In particular, the mind will try to perceive the scene as a whole rather than as a sum of parts.

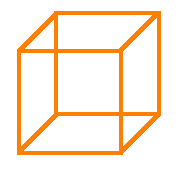
For example, when you see the following illustration…

Image of a cube

…you probably recognize it as a cube. You don’t think of it as twelve separate lines, nor do you think of it as four parallel horizontal lines, four parallel vertical lines, and four parallel diagonal lines.

In trying to explain how the mind tries to perceive complex scenes, Wertheimer elucidated the following laws that contribute to the Law of Prägnanz. We’ll take a look at each one and try to find examples relevant to user interface design.

Law of proximity

Items that are located close together are usually perceived as a single group. The items in that group are considered to be distinct and different from items located further away.

For example, in the following image, we seem to perceive three separate groups:

    o o o                                 o o
    o o o          o o o o o              o o
    o o o          o o o o o              o o
                   o o o o o              o o
                   o o o o o

And in the following image, some of these dots appear to be arranged in rows, and others in columns.

    o o o o o o o o o o o        o     o     o     o     o
                                 o     o     o     o     o
    o o o o o o o o o o o        o     o     o     o     o
                                 o     o     o     o     o
    o o o o o o o o o o o        o     o     o     o     o

It’s due to their proximity. The distance between the dots making up each row or column is less than the distance between a dot in one row or column and the nearest dot in the next row or column.

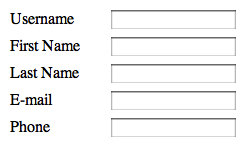
Applying the law of proximity to user interface design, take a look at this form:

Data-entry form where the labels are separated by a great distance from the corresponding text-entry fieldsConceptually, each label matches up with a corresponding text-entry field. And yet the labels are so far away from the text-entry fields that the labels appear to form their own group, and the fields appear to form another group. The connection between each label and its corresponding field isn’t perfectly obvious.

One way to fix this is to move the labels and fields closer together so that we’re emphasizing the horizontal pairs of labels and fields rather than the two columns:

Data-entry form where the labels and text-entry fields are aligned closely together

Law of similarity

Visual items that share some property or attribute are perceived as belonging together, whereas items with differing properties or attributes are perceived as belonging to different groups.

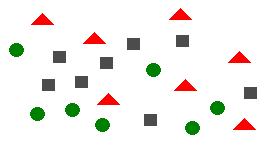
For example, in the following image, you can probably detect three groups, even though the items in those groups aren’t in proximity to each other:

Image of interspersed red triangles, green circles, and grey squares

This is the law of similarity at work with two attributes: shape and color. The red triangles are easily detectable because they share the same shape and color, and the red triangles are distinguishable from the green circles and the grey squares because those items differ in those two attributes.

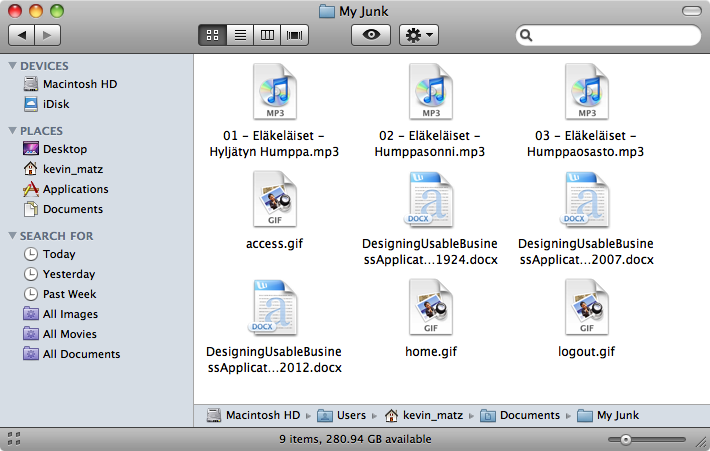
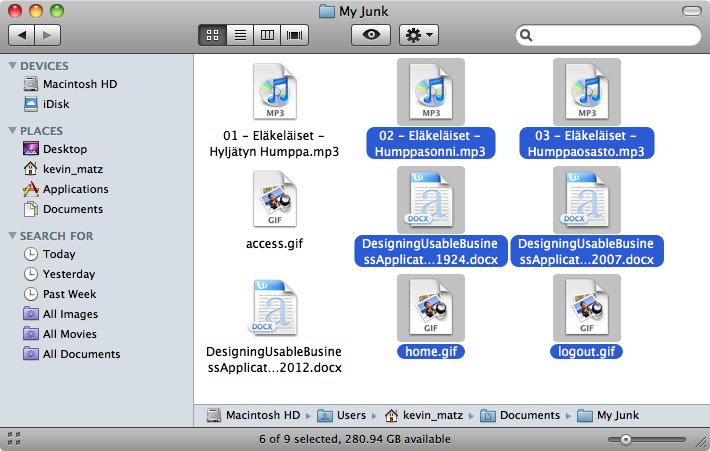
An example from UI design comes from file managers in operating systems: Usually, all of the files of the same type (like MP3 files) are decorated with the same icon, to provide a visual indication that those files share something in common. In the following example from my Mac, the icons aren’t different enough that you can instantly tell that they’re different (they all have the same basic “curled page” shape and they all have a bit of blue in them), so the effect is not quite as strong as it could be:

Mac OS "Finder" window showing files of different types with corresponding icons

However, in the next image, the “highlighting” decoration on selected items easily differentiates the group of selected items from the group of unselected items:

Mac OS "Finder" window with six of nine icons selected; the selected icons are highlighted

Returning to the data-entry form example, if we wanted to improve the form without moving the groups closer together, we could also try making the pairings more explicit by making sure that each label and field share an attribute, like the background color:

Data-entry form where rows are highlighted with alternating background colors

Law of continuation

Visual items that appear to be a continuation of a preceding sequence or line of similar items are perceived as belonging together. As well, once your eye begins following the line or sequence, it will continue doing so until something else catches your attention.

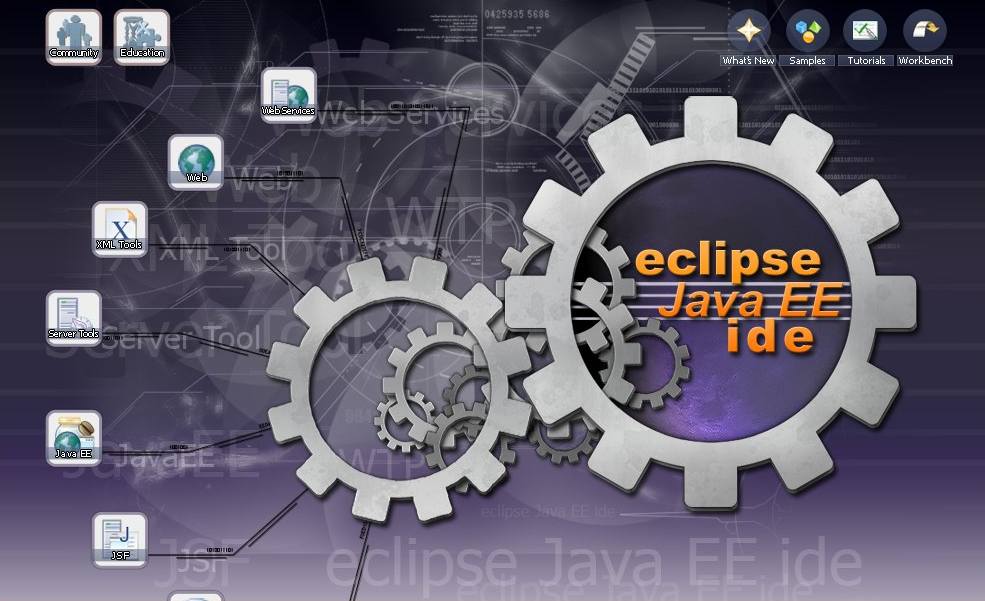
For example, the icons on this Eclipse splash screen are arranged to a form a curve that your eye is likely to follow:

Splash screen for the Eclipse Java EE IDE, with icons arranged in a curve

Law of closure

Lines (or visual elements that are repeated to form lines) are more likely to be perceived together as a common visual unit if they appear to form the outline or “closure” of a surface or shape, even if that outline is not complete. The mind fills in any gaps in incomplete shapes, to achieve closure in the form of a familiar shape.

In the following classic example, we perceive the image to be a circle, even though part of the circle is missing:

Circle with a small gap missing

Our minds fill in the missing gap because “it’s a circle with a piece missing” is an easier and more satisfying explanation than, say, “it’s an arc spanning about 320 degrees”.

I can’t think of many immediate applications to user interface design, with the exception of logos and other decorative artwork that might appear on webpages or splash screens. Some visual designers suggest that incomplete shapes can create interest; the mind has to do a bit of work to fill in the missing information, and this “puzzle-solving” is apparently captivating and eye-catching. For example, this logo crops a geometric flower shape, and it’s somewhat eye-catching because you have to complete the pattern to achieve closure:

Logo with an abstract flower shape cropped so that part of the flower is cut off

Law of common fate

Visual elements moving together in the same direction simultaneously tend to be perceived as a group.

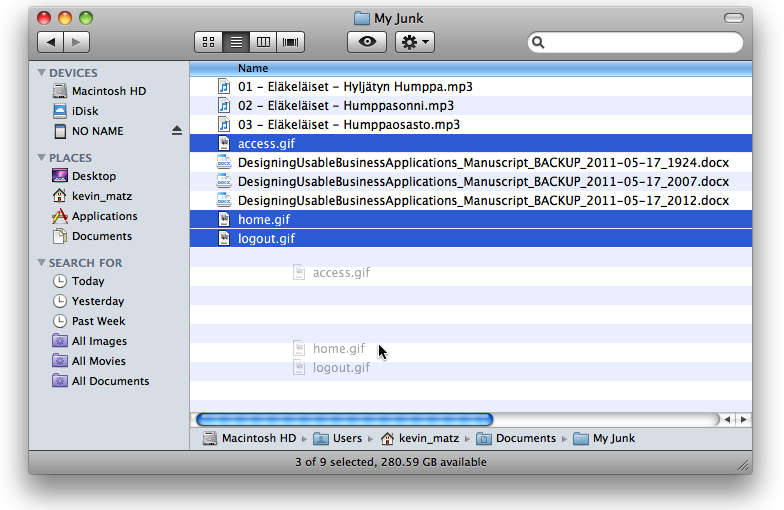
For example, in Microsoft Windows or Mac OS, if you select a number of icons and then drag-and-drop them, partially-transparent copies of all of the selected icons move together as a group:

Files being moved in Mac Finder

Law of good continuation (or “good gestalt”)

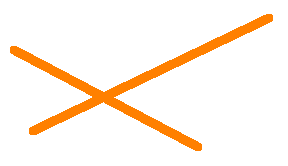
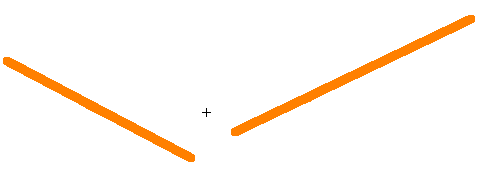
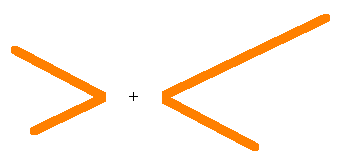
Line segments that are smooth continuations of each other are perceived as the same line, even in the case of intersections of multiple line segments.

For example, when you see this figure:

You probably perceive it as the two straight lines crossing:

You are unlikely to perceive it as two angles meeting, even though that is a possibility as well:

Your mind knows from experience that the “two straight lines crossing” is more plausible.

I can’t think of a good application of this law to UI design, but I’ve included it for completeness.

Further laws

Beyond Wertheimer’s laws, additional laws have been proposed, such as:

Law of common region (Palmer, 1992)

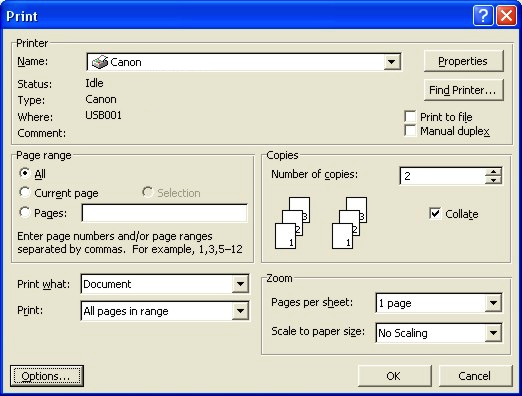
Visual items situated together in demarcated (bordered) regions are perceived as belonging together.

For example, in this Print dialog from Microsoft Word, controls are contained in frames; obviously all of the controls in the “Copies” frame belong together and relate to controlling the number of copies:

Print dialog from Microsoft Word on Windows XP

Law of synchrony (Palmer and Levitin, 1998)

Visual items that change at the same time will tend to be perceived as belonging together as a unit.

Law of connected elements (Palmer and Rock, 1994)

If items are joined together to form a compound item, that compound item will tend to be perceived as a single object (not surprisingly).

Summary

The Gestalt Laws of Perception help us understand how people interpret visual designs. In designing user interfaces, applying these laws can often help us to reinforce our underlying conceptual models. For example, we can intentionally group related fields together on the screen to indicate that they are related, or use similar icons or other decorations to provide visual clues that certain objects belong to a certain class.

We will continue our examination of visual design techniques in upcoming blog posts.

[ad#AdSense_Banner]

Posted in Visual Design | 2 Comments

How do people look at and read pages? (Part 3 of 3)

In Part 1 and Part 2 of this series, we looked at how readers look at pages or screens and what typical paths a reader’s eye follows when scanning visual information.

When designing a software application or website, if want to try to intentionally direct our users’ attention to something, or at least influence their eye movements when they look at a page, there are some tricks we can use:

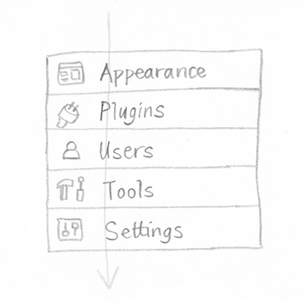
  • A list of similar elements (like site navigation buttons) in a row or column will usually draw the reader’s eye down the list, if it is vertical, or across, if it is horizontal. If the list is long, the entries at the beginning and end are more likely to be noticed and read than the ones in the middle.

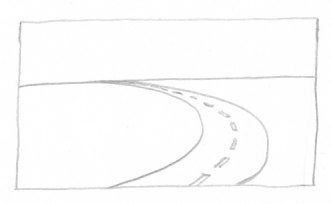
  • If the page is dominated by a large, curved, sweeping line or shape, the reader’s eye will typically follow that curve.

  • Arrows and pointy shapes can direct the reader’s eye towards something. Likewise, if you have pictures of people looking or pointing at something, the reader will naturally gravitate to look at the object of attention.

Cartoon of man pointing to a "Buy Now" button

  • The best way to attract the viewer’s attention to something is to create contrast. Make the target element different from the things surrounding it:
  • A photo or graphic will stand out in a sea of text.
  • On a page dominated by vertical and horziontal lines and boxes, anything diagonal or tilted will attract attention.
  • If a page is crowded with content, but there is an open area where an object is surrounded by generous whitespace, then the reader’s eye will gravitate towards the open empty space and the object within it.
  • A splash of color in a sea of black-and-white or grey attracts attention to itself; a brighter, intense color will stand out amongst more subdued colors (like yellow on blue).

Knowing a bit about how users scan and read pages and screens puts us in a better position to be able to design good screen layouts. We’ll talk about page composition and visual design techniques in upcoming posts.

[ad#AdSense_Banner]

Posted in Visual Design | Leave a comment